

A Configuration Guide for B2B Buyers
Most buyers request a video brochure quote before they fully understand what they’re actually configuring. That creates confusion because a video brochure is not a single product with a fixed price. It is a combination of screens, batteries, printing, packaging, assembly, logistics, and services, each with its own cost level.
This guide breaks down the main pricing variables so B2B buyers can evaluate quotes more accurately before production starts.
The Core Variables
Video brochure pricing is mainly driven by five areas:
- Screen size and type — usually the largest single cost driver
- Hardware quality — battery, motherboard, speaker
- Print finish and packaging — cover material, surface treatment, structure
- Order quantity — setup costs spread across units
- Included services — preloading, QC, shipping terms
Each variable has:
- a budget tier
- a balanced tier
- a premium tier
Understanding where each one sits inside a project is usually more important than comparing factory pricing alone.
Screen Size and Type
Size Determines More Than Just the Display
The LCD panel is typically the most expensive single component in a video brochure. Once the screen size increases, several related costs increase with it.
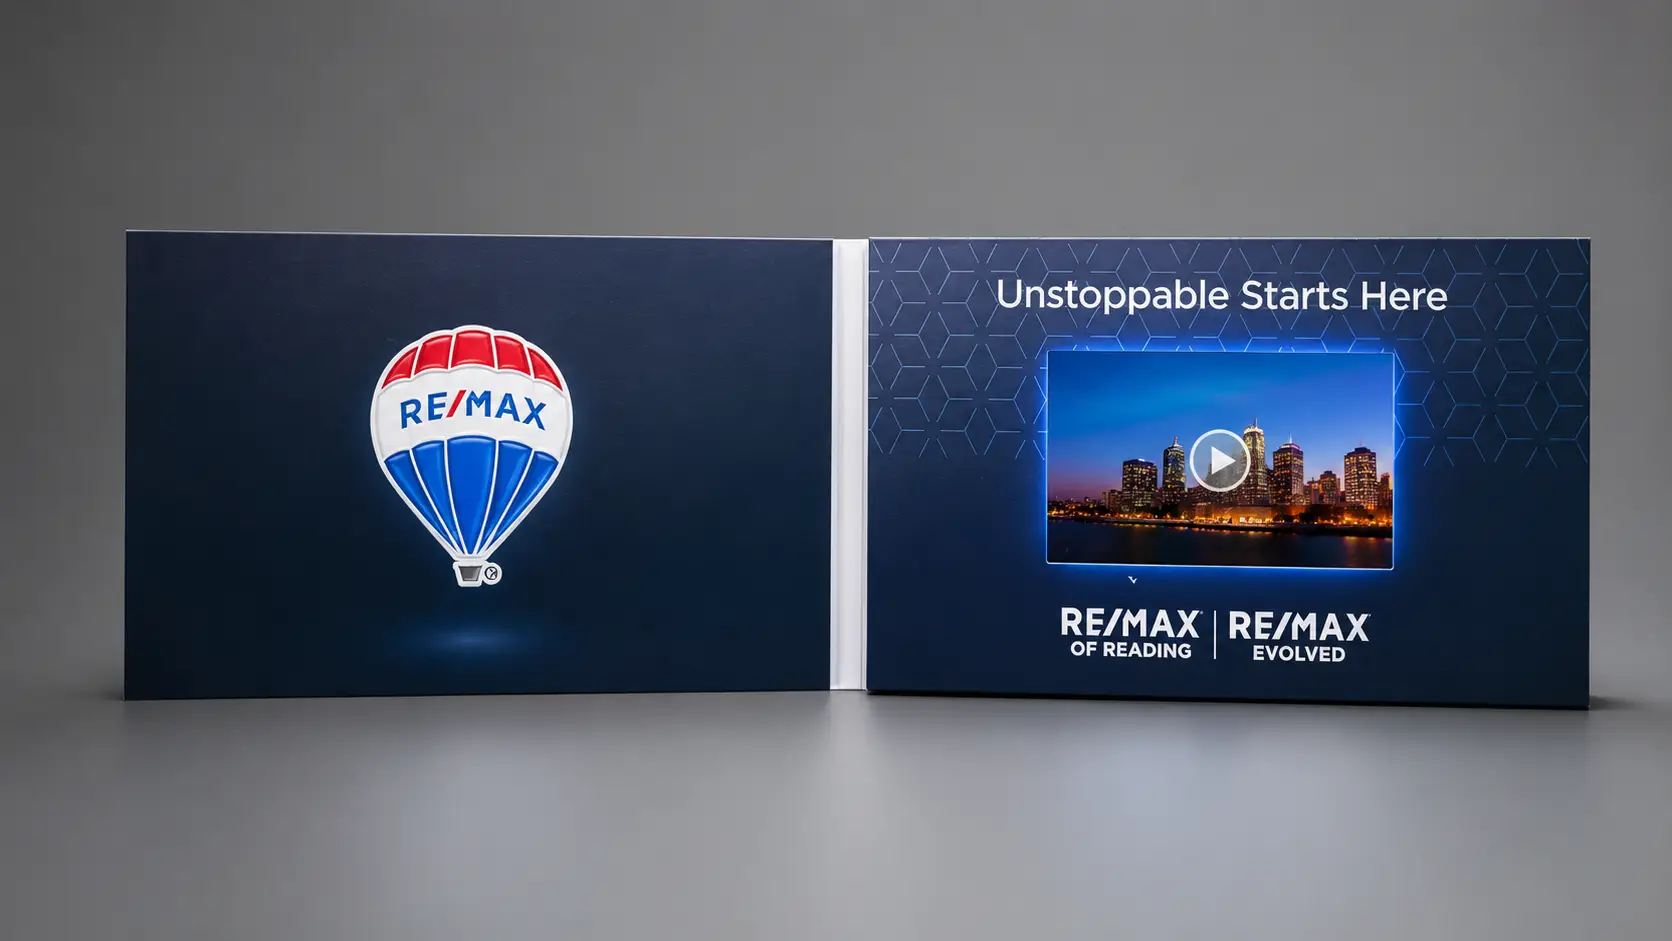
Larger screens require larger batteries, deeper packaging structures, and higher freight. The cost increase compounds across the whole unit.
| Screen Size | Typical Use Case | Cost Level |
|---|---|---|
| 2.4" | Video greeting cards | Low |
| 4.3" | Direct mail campaigns | Medium |
| 5" | Sales presentations, real estate | Medium |
| 7" | Premium B2B presentations | High |
| 10" | Luxury presentation boxes | Very High |
A larger screen requires:
- a larger LCD panel
- a stronger battery
- a larger printed cover
- deeper packaging
- more protective freight packaging
That is why the cost increase from 4.3" to 7" is rarely linear.
TFT vs. IPS
Screen type is separate from screen size, and it affects both presentation quality and pricing.
| Screen Type | Visual Quality | Best For |
|---|---|---|
| TFT | Basic | Entry-level promotions |
| IPS | Better color and viewing angle | Sales meetings, real estate |
| HD IPS | Premium | Luxury presentations |
| Touchscreen | Interactive | Product demos |
IPS panels cost more than TFT panels because:
- color quality is stronger
- viewing angles are wider
- brightness looks more stable
- the presentation feels more premium
For campaigns where brand presentation matters, screen type usually affects perception more than buyers expect.
Hardware: Battery, Motherboard, Speaker
Battery Capacity and Quality
Battery quality affects playback reliability, lifespan, and charging stability. It is also one of the least visible variables inside a quote.

Battery requirements scale with screen size. Larger IPS screens require more stable power support than smaller TFT panels.
Lower-cost configurations often reduce hardware cost through:
- lower-capacity cells
- recycled batteries
- lower-grade PCB boards
In practice, this usually leads to:
- shorter playback time
- unstable charging
- inconsistent performance over time
Standard playback for a 400–600mAh battery is normally around 60–90 minutes under standard use conditions.1
For projects used repeatedly in sales meetings or presentations, hardware quality becomes a long-term reliability issue rather than a launch-day issue.
Memory: Match to Content Requirements
Memory is often treated as a major pricing factor, but the difference between common memory tiers is relatively small compared with screen or packaging cost.
| Memory | Suitable For |
|---|---|
| 128MB | Short single video |
| 256MB | Standard marketing video |
| 512MB | HD presentation |
| 1GB+ | Multiple HD videos |
Oversizing memory adds cost without improving playback performance. Undersizing memory creates playback issues once larger HD files are added.
Motherboard and Speaker Quality
Lower-grade motherboards typically create:
- playback lag
- freezing
- inconsistent performance across units
Speaker quality also changes the presentation experience significantly, especially during in-person sales meetings.
These components rarely appear clearly inside quotations, but they become immediately visible during real use.
Print Finish and Packaging
First Impressions Start Before Playback
Before the video plays, the cover material, texture, structure, and finishing quality have already communicated something about the brand behind the project.
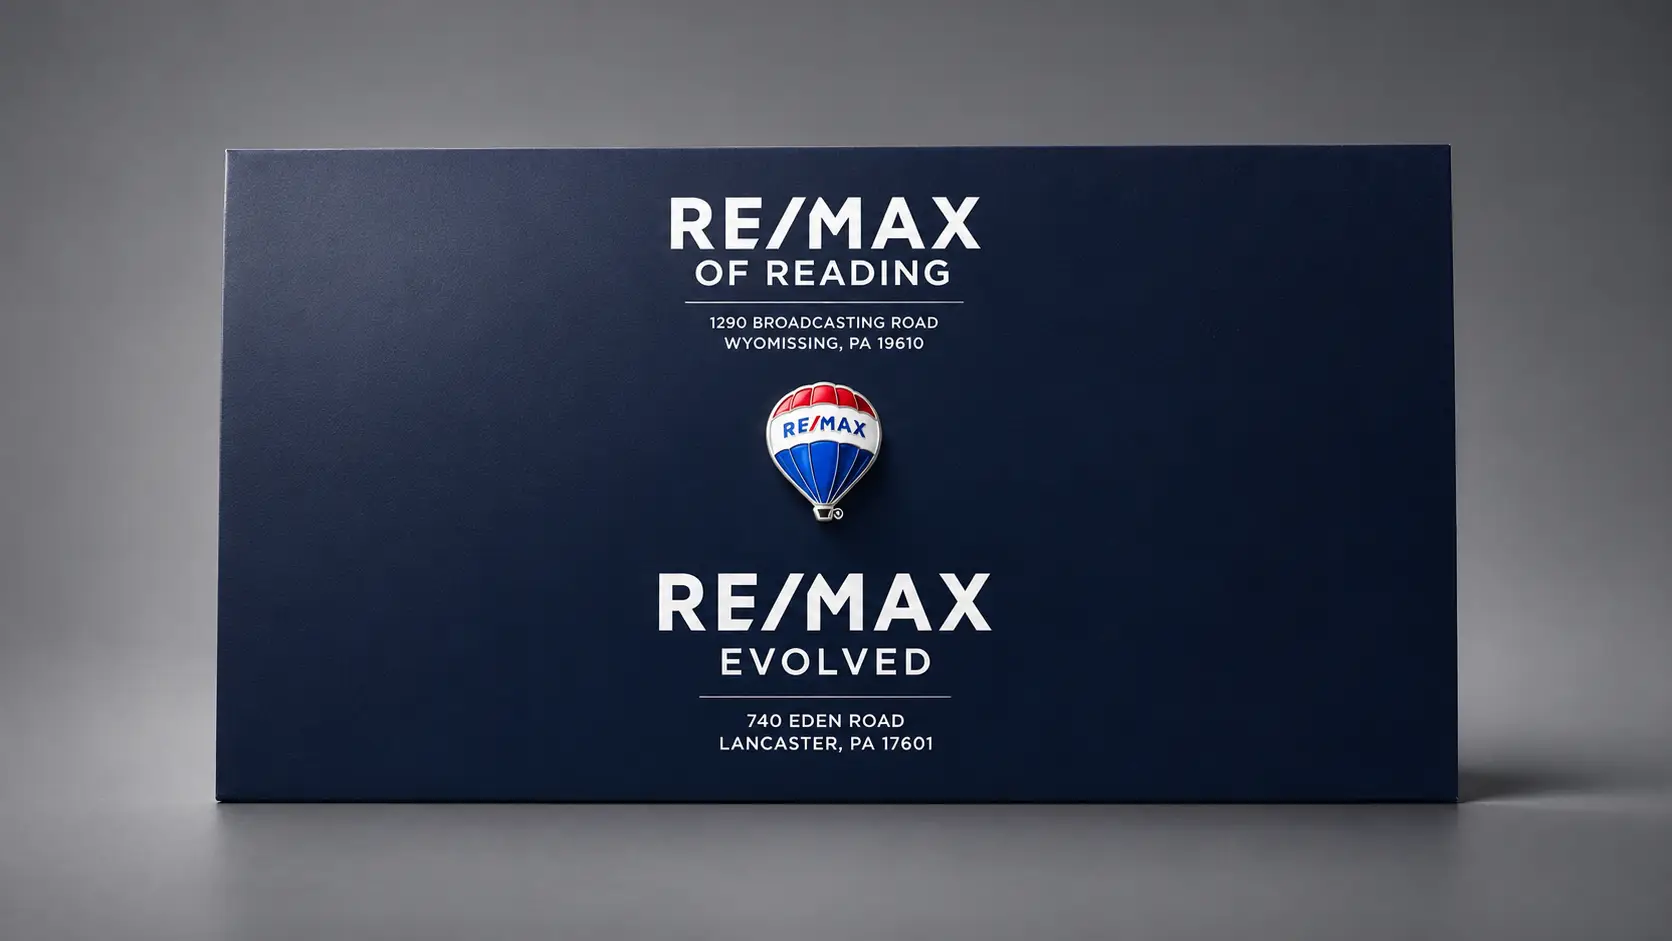
Soft-touch lamination, foil stamping, embossing, and spot UV each add production steps and affect the overall presentation feel.
Cover Structure: Soft vs. Hard
| Structure | Characteristics | Cost |
|---|---|---|
| Softcover | Lighter, thinner, easier to ship | Lower |
| Hardcover | More rigid, premium feel | Higher |
Hardcover versions require:
- thicker board materials
- more manual assembly
- more precise wrapping work
For luxury presentations or long-term sales kits, hardcover structures usually create a stronger perceived value despite the higher unit cost.
Surface Finishes
| Finish | Effect | Cost Impact |
|---|---|---|
| Matte / gloss lamination | Standard protection | Low |
| Soft-touch lamination | Premium tactile feel | Medium |
| Foil stamping | Metallic accent | Medium |
| Spot UV | Gloss contrast effect | Medium |
| Embossing / debossing | Raised or pressed texture | Medium–High |
Each finish adds:
- setup time
- labor
- production complexity
- additional QC requirements
Complex finishing also increases production timelines, especially during larger campaigns.
Packaging
Custom packaging changes both presentation quality and total project cost.
Examples include:
- magnetic gift boxes
- EVA foam inserts
- rigid presentation kits
- printed sleeves
For influencer kits, luxury launches, or executive presentations, packaging often affects perceived value as much as the screen itself.
Order Quantity
Why Small Orders Cost More Per Unit
Every custom project requires:
- engineering setup
- print calibration
- screen testing
- assembly preparation
- QC procedures
Those setup costs remain relatively fixed regardless of quantity.2
| Quantity | Unit Cost Trend |
|---|---|
| 10–25 pcs | Highest per unit |
| 50–100 pcs | Medium |
| 250–500 pcs | Lower |
| 500+ pcs | Lowest per unit |
The product itself has not changed. The setup cost is simply distributed across more units.
That is why many first-time projects begin with:
- a sample
- a small pilot run
- a short campaign test
before scaling into larger production.
Included Services and Shipping Terms
What’s Actually Included in the Quote
Two quotations with similar unit pricing can represent very different total project costs depending on what is included.
Common exclusions in lower-cost quotes:
- video preloading
- advanced QC
- magnetic closure setup
- button programming
- DDP shipping
These costs usually appear later during production rather than at the quotation stage.
Shipping Terms
Shipping terms significantly affect total landed cost.3
| Term | What It Covers | Buyer Handles |
|---|---|---|
| EXW | Factory pickup only | Freight, customs, duties |
| FOB | Delivery to origin port | Customs, duties, local delivery |
| DDP | Full delivery | Nothing |
An EXW quotation may initially appear cheaper than a DDP quotation. Once freight, customs clearance, import duties, broker coordination, and local delivery are added, the final landed cost can shift significantly.
For buyers in the US, EU, and UK, DDP usually creates more predictable landed cost and removes customs-related variables from the project timeline.
Delays Often Cost More Than Hardware
In many B2B campaigns, the largest hidden cost is not the hardware itself. It is project delay.
Delays often come from:
- unclear artwork files
- repeated revision cycles
- slow communication
- missing accessories
- incomplete production confirmation
For projects connected to:
- trade shows
- product launches
- investor meetings
- real estate presentations
those delays can become more expensive than the original hardware savings.
That is one reason experienced buyers increasingly evaluate:
- communication speed
- production visibility
- supplier responsiveness
- delivery reliability
alongside unit pricing.
Matching Configuration to Campaign Goals
The best configuration is rarely the most expensive one. It is usually the one that matches the actual campaign use case.
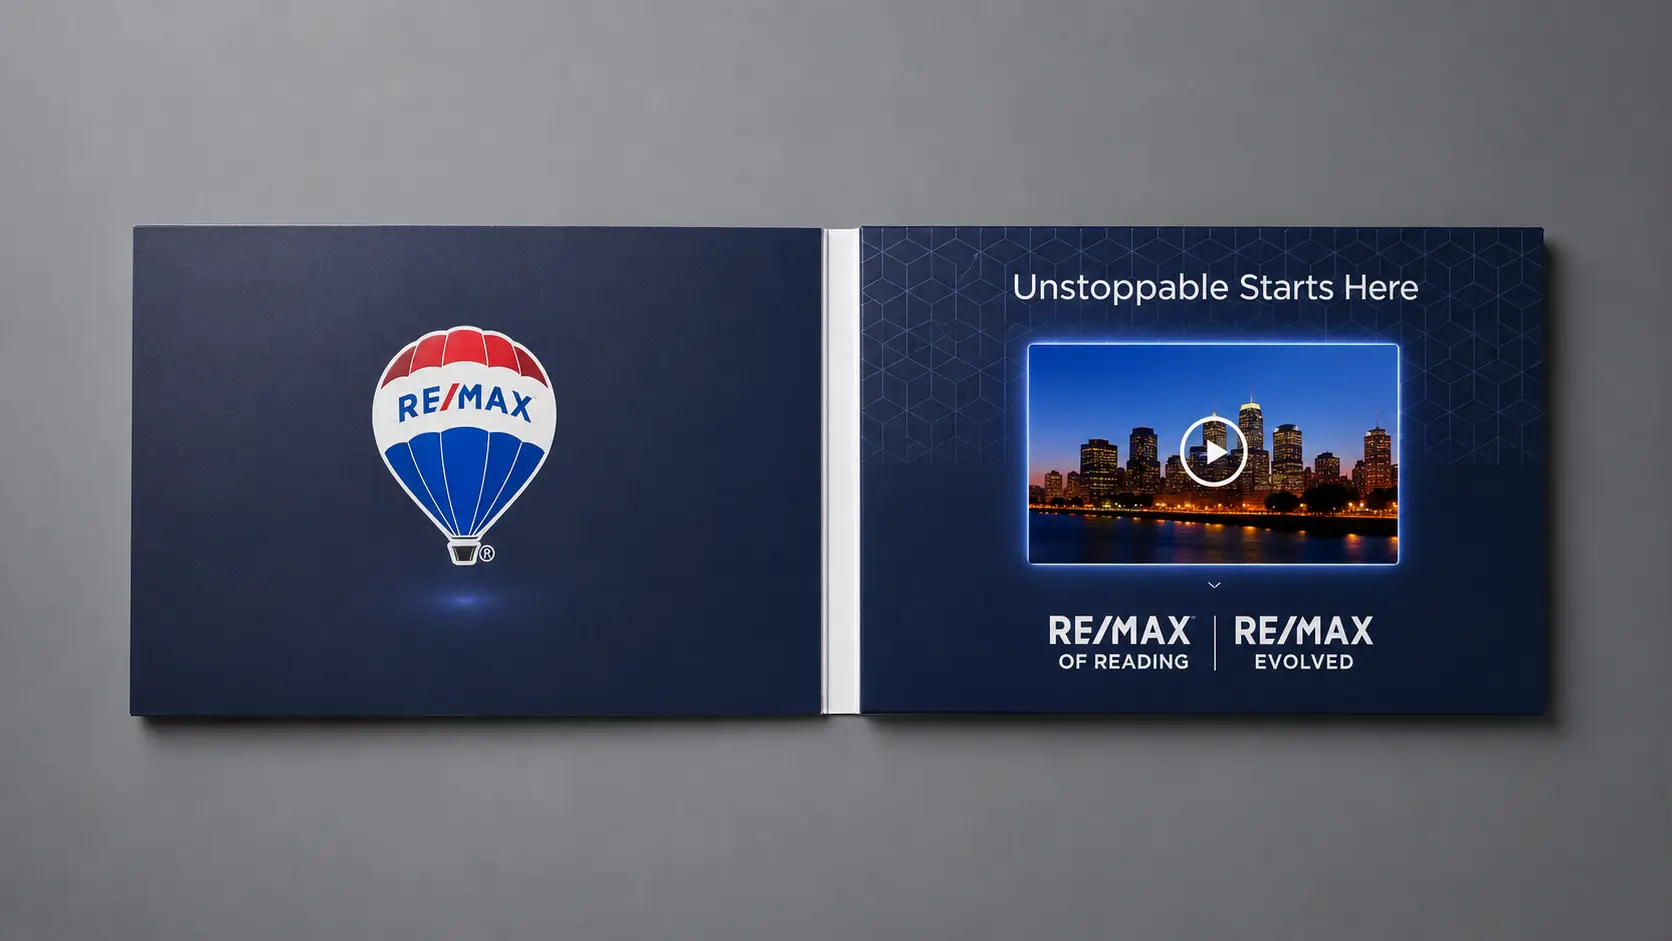
Configuration recommendations by campaign type — screen size, finish level, and hardware tier.
| Campaign Type | Screen | Finish | Hardware |
|---|---|---|---|
| Direct mail / high volume | 4.3" TFT | Matte or gloss | Standard battery, 128–256MB |
| Real estate presentations | 5"–7" IPS | Soft-touch | Medium battery, 256MB |
| B2B industrial / medical demo | 7" IPS | Premium print | Larger battery, 512MB |
| Luxury brand / VIP gifting | 7"–10" HD IPS | Hardcover + foil | Premium battery, 1GB+ |
Over-specifying a project — oversized screens, maximum memory, excessive finishing — increases:
- unit cost
- freight cost
- production complexity
- delivery risk
without always improving campaign performance proportionally.
The strongest configurations are usually the ones aligned with the real presentation goal.
Questions to Clarify Before Requesting a Quote
Clear project information usually produces more accurate quotations and fewer revision cycles.
- What screen size fits the intended packaging format?
- Is the brochure for single-use mailers or repeated presentations?
- How long is the video content?
- What resolution will the content use?
- What finish level matches the brand standard?
- Is this a pilot run or a full campaign rollout?
- Does the project require preloaded content before shipment?
Summary
| Variable | Lower Cost | Higher Cost |
|---|---|---|
| Screen | Small TFT | Large IPS / HD IPS |
| Battery | Standard capacity | High-capacity tested cells |
| Memory | 128MB | 512MB–1GB+ |
| Cover | Softcover | Hardcover premium finish |
| Packaging | Standard box | Custom magnetic structure |
| Quantity | 10–50 units | 500+ units |
| Shipping | EXW | DDP |
| Services | Basic | Preloading + expanded QC |
Final Thought
The lowest quote is not always the lowest-cost project over time.
Successful video brochure projects usually come from balancing:
- presentation quality
- hardware stability
- communication efficiency
- delivery reliability
- campaign requirements
from the beginning rather than correcting problems later in production.
The better the configuration matches the actual use case, the more predictable the project becomes after delivery.
Footnotes
-
Battery capacity in video brochures is typically measured in mAh. A 400–600mAh battery usually supports approximately 60–90 minutes of continuous playback under standard conditions. ↩
-
Setup costs in custom manufacturing — tooling, print calibration, assembly preparation, and QC — remain relatively fixed regardless of order quantity. Per-unit pricing decreases as those costs are spread across more units. ↩
-
EXW, FOB, and DDP are standard Incoterms defined by the International Chamber of Commerce (ICC). Each term allocates freight cost, customs responsibility, and delivery risk differently between buyer and seller.